ARM+FPGA+AI-based Smart Ship Condition Monitoring System (Part 2): Hardware and Software Design, Analog and Temperature Data Acquisition and Analysis
Based on the overall equipment design, the hardware board set has been determined to consist of one core board and three functional boards. The core board is procured externally, while the three functional boards are self-developed. The core board for this project primarily includes the ZYNQ main control chip, among others. The specific chip model needs to be further determined. Based on project requirements and detailed analysis, the main requirements for selecting the core board are as follows:
(1) Since this design involves multi-channel vibration signal, temperature signal, analog voltage, and current data acquisition, as well as the design of multiple communication interfaces, there is a significant demand for resources such as the main control chip's pins. Furthermore, as these functionalities are implemented on the FPGA, substantial FPGA logic resources are also required. Additionally, for data storage using solid-state drives, the main control chip needs to possess high-speed interface resources.
(2) Given the numerous functionalities and large data volume involved in this project, the data cache capacity should be as large as possible. Moreover, to manage the extensive functional tasks mentioned above, a reasonable analysis suggests that the CPU clock frequency should not be lower than 1GHz and should be as high as possible.
Through research, this project found that Xilinx's ZYNQ series introduced a new generation of UltraScale architecture. This architecture is optimized based on the ZYNQ-7000 series chips, offering more logic resources and superior operating speed compared to its predecessors. This series includes two types: ZYNQ UltraScale+ MPSoC and ZYNQ UltraScale+ RFSoC. The latter is suitable for RF applications in radar, which differs from the research direction of this project and would lead to unnecessary resource waste. Therefore, this project adopted the ZYNQ UltraScale+ MPSoC chip [41]. Based on the proposed technical specifications, it was determined that the engine room monitoring equipment requires strong data caching and processing capabilities. Thus, selecting a DDR chip with a higher CPU clock frequency, faster cache speed, and larger capacity is beneficial for long-term equipment operation and future product upgrades. Considering all project indicators, a core board designed by a certain company, compliant with industrial-grade standards, namely the XCZU5EV core board, was selected as the core control board for the monitoring equipment. The physical diagram of this core board is shown in Figure 3-1.
3.3 Analog Board Design
The analog signal acquisition board, as one of the system's functional boards, is responsible for acquiring vibration signals, analog voltage, analog current, and temperature signals.
3.3.1 Vibration Signal Acquisition Circuit Design
3.3.1.1 Vibration Sensor Selection
In ship vibration monitoring, selecting an appropriate vibration sensor is crucial. Ship vibration is caused by forces acting on various onboard equipment, which lead to changes in the structure's shape and position. To characterize this vibration, parameters such as displacement, acceleration, and velocity can be used. Different parameters have distinct characteristics and applicability. Since changes in ship equipment are fundamentally caused by changes in force, measuring acceleration can directly provide information about the forces acting on ship equipment [42]. Furthermore, acceleration can be integrated to obtain velocity and displacement information. Therefore, this project selected an accelerometer as the parameter for vibration signal acquisition.
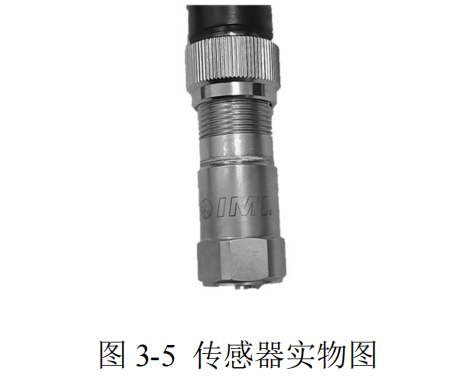
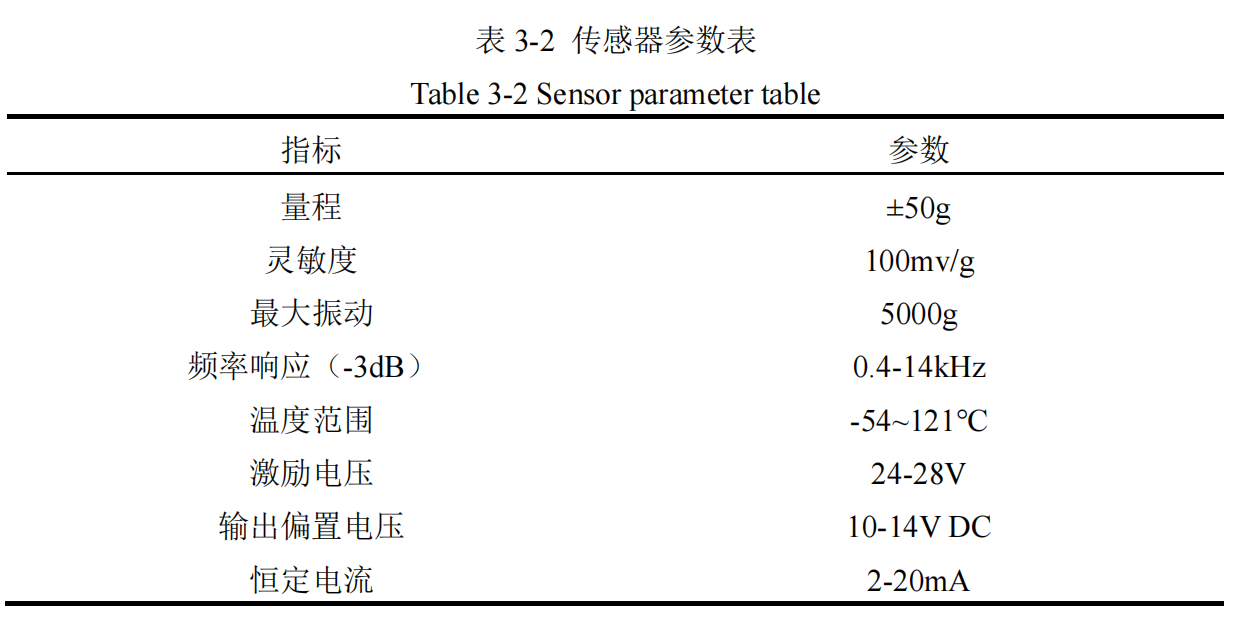
Accelerometers include various types, primarily capacitive, piezoresistive, and piezoelectric. Through research, this project found that the vibration frequencies generated by various ship equipment are mainly low-frequency signals. Among the three sensor types, piezoelectric sensors are more suitable for measuring low-frequency vibrations compared to the other two. Therefore, this project selected the 603M170 industrial ICP/IEPE accelerometer from IMI, USA. This sensor has a frequency measurement range of 0.4~14KHz, featuring high sensitivity and fast response, which ensures signal accuracy and real-time performance. Additionally, the sensor boasts good temperature resistance and corrosion resistance, enabling it to adapt to potential high temperature, humidity, and corrosive factors in the ship's operating environment. The sensor is shown in Figure 3-5.
3.3.1.2 Analog Signal Conditioning Circuit Design
The analog signal conditioning circuit in this project primarily works in conjunction with ICP/IEPE sensors, aiming to achieve high-precision acquisition of vibration signals. Since the output signal amplitude of the selected accelerometer is not within the ADC's sampling range, and the signal is prone to interference from various external signals during transmission [43], a signal conditioning circuit is designed in this vibration signal acquisition circuit to adjust the detection range and anti-interference capability for vibration signals. The block diagram of the analog signal conditioning circuit is shown in Figure 3-6, including the sensor power supply circuit, DC-blocking circuit, anti-aliasing filter circuit, and single-ended to differential conversion circuit.
3.3.2 Analog Voltage/Current Acquisition Circuit Design
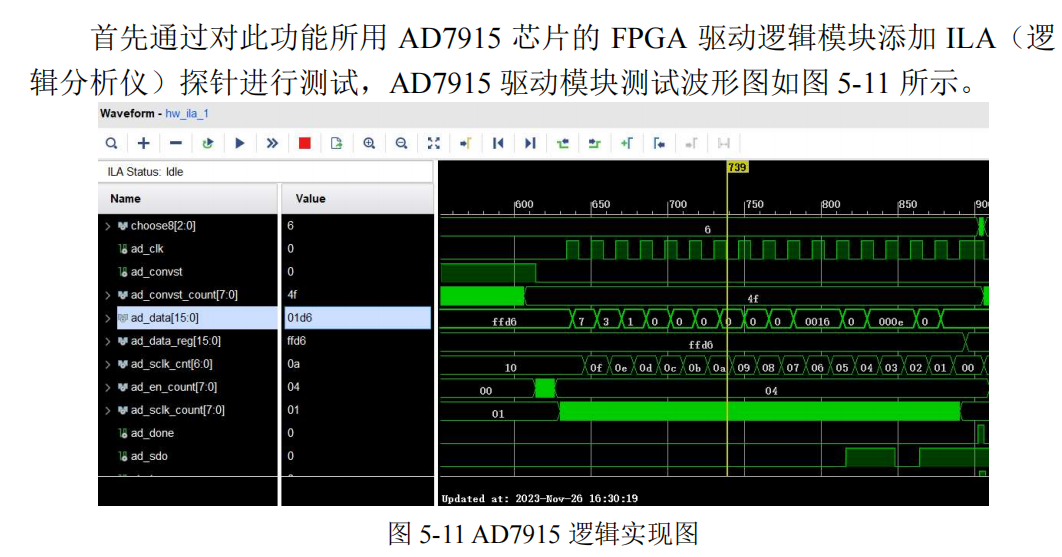
According to the technical specifications defined for the project, the analog voltage and current acquisition function requires the design of 8-channel voltage signal and 8-channel current signal acquisition circuits. Among these, the 8 voltage signals should have a range greater than 10V, and the other 8 current signals should include a 4~20mA range. This project sets the ADC resolution to 16 bits, ensuring data acquisition accuracy and sampling rate meet technical specifications. Considering board size limitations, a multiplexing approach is adopted. Under these conditions, the ADC chip was selected, and through analysis, Analog Devices' AD7915 analog-to-digital converter, suitable for this multiplexed design, was chosen. The overall design block diagram is shown in Figure 3-18.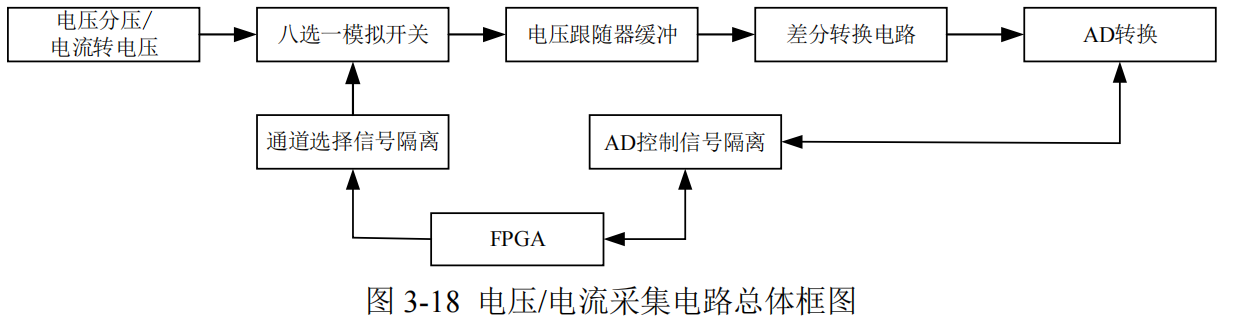
Equipment Function Test and Verification
In previous stages, this paper successfully completed the hardware and software design of the ship monitoring equipment. However, a critical part of the project lies in verifying whether the performance and functionality of this platform meet the user's technical requirements. Therefore, this chapter will focus on how to conduct functional and performance verification for this ship monitoring equipment. First, the specific test content will be detailed, followed by an overview of the test environment and instruments used. Subsequently, the equipment's functions will be tested sequentially according to technical specifications. Finally, a detailed analysis of the test and performance verification results for the ship monitoring equipment will be provided.
5.1 Equipment Test Content
The ship engine room monitoring equipment developed in this project comprises numerous functional modules. From analog hardware circuits to FPGA digital hardware logic, and then to ARM-side software control, these elements collectively realize the functionalities of each module. For testing, a hardware-first, then software approach should be maintained. Given the large number of hardware circuits to be tested in this project, a direct functional test of each monitoring equipment module was chosen to demonstrate its effectiveness. First, the power supply is tested, followed by sequential tests of the vibration signal acquisition function, analog voltage/current acquisition function, RS232/485 communication function, CAN module communication function, and dual Ethernet port communication function.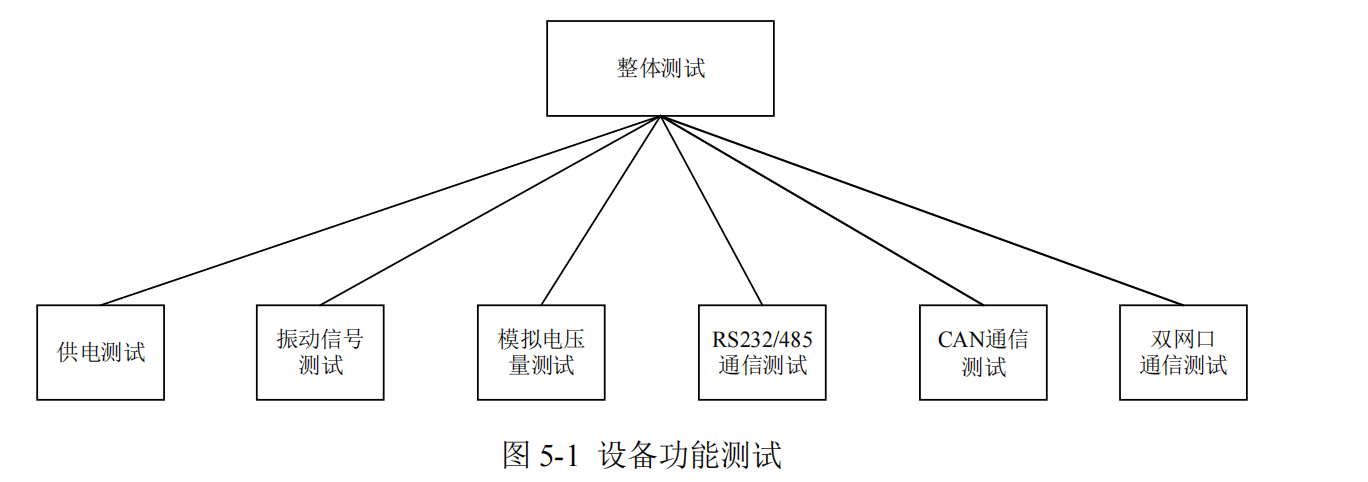
5.2 Test Environment
5.2.1 Physical Equipment Diagram
The physical circuit boards and personal laboratory test environment for the ship engine room monitoring equipment developed in this project, excluding the chassis, are shown in Figure 5-2.
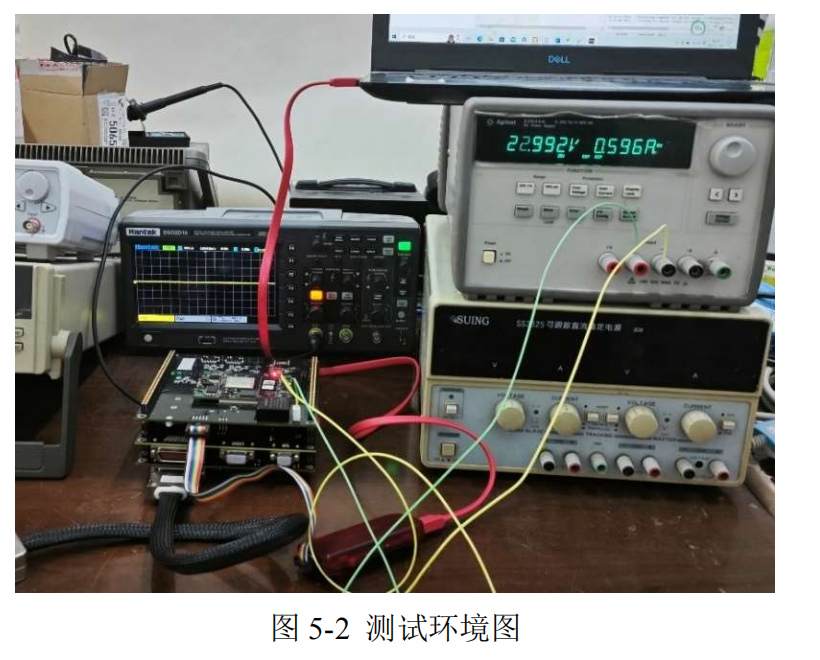
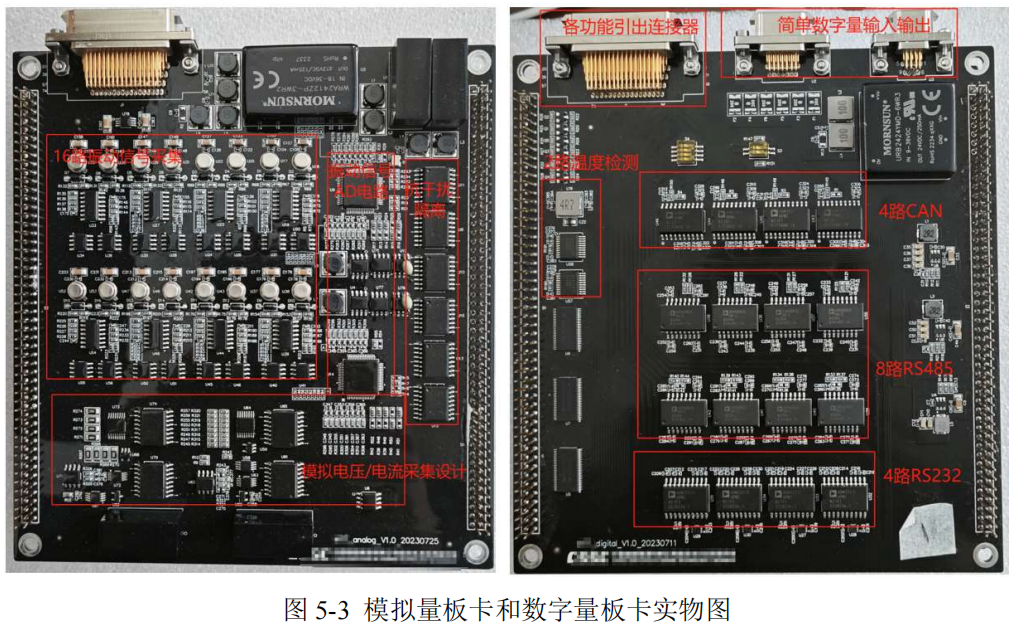
The structure adopts a three-layer stacked design, corresponding to the three major unit modules in the hardware design. During manufacturing, industrial-grade and military-grade components, functional assemblies, and modules were strictly selected, and all underwent three-proofing treatment. The three circuit boards are shown in Figures 5-3 and 5-4. Due to insufficient space on the analog acquisition board, the temperature acquisition circuit was designed into the digital board.

5.4 Vibration Signal Acquisition Function Test
Vibration signals play a crucial role in ship engine room monitoring as they provide important information regarding the operational status of engines and other equipment, as well as the hull's condition. Therefore, this section aims to test the vibration signal acquisition and processing capabilities of the self-developed ship engine room monitoring equipment.
For signal measurement, a signal generator was used to simulate signals during testing, and an oscilloscope was used for comparison to verify signal parameters. The schematic diagram of the test connections for each device is shown in Figure 5-5.
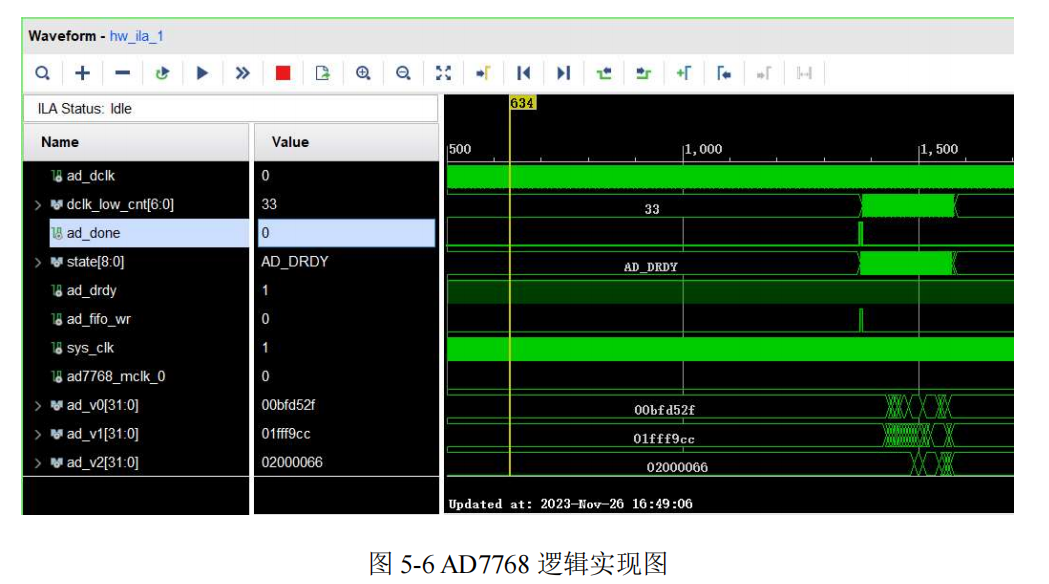
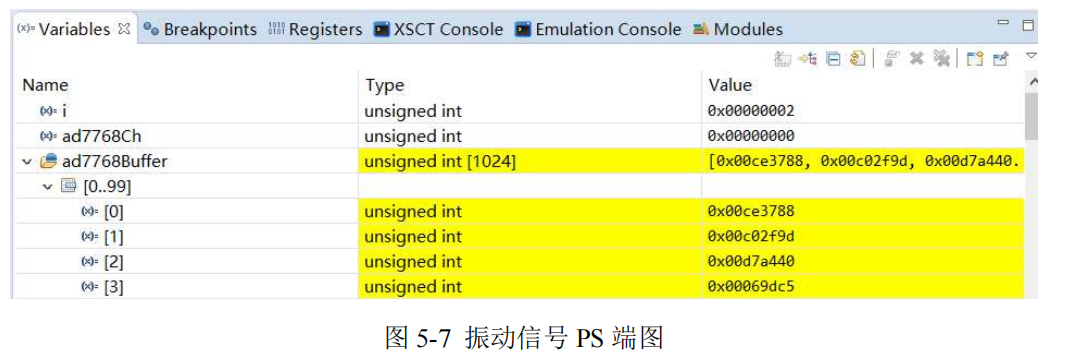
First, ILA (Integrated Logic Analyzer) probes were added to the FPGA driver logic module of the AD7768 chip used for this function. After power-up, the bitstream was programmed, and the debugging interface was accessed. The test waveform diagram for the AD7768 driver module is shown in Figure 5-6.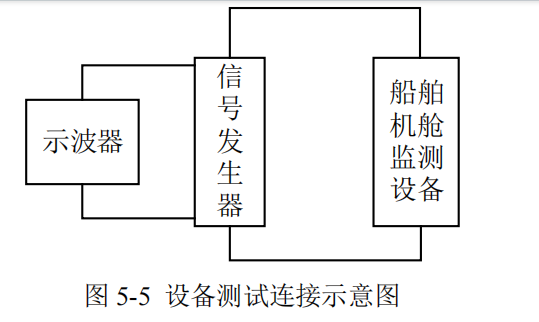
5.5 Analog Voltage/Current Acquisition Function Test
Analog voltage and current tests aim to verify the performance of the ship monitoring system's analog signal acquisition module, ensuring its ability to accurately and stably acquire analog voltage (0 to 10V) and analog current (4 to 20mA) signals, meeting the specified requirements.
During testing, a DC power supply was used to generate test signals, and a high-precision multimeter was used to verify signal parameters. The equipment connection diagram is shown in Figure 5-10.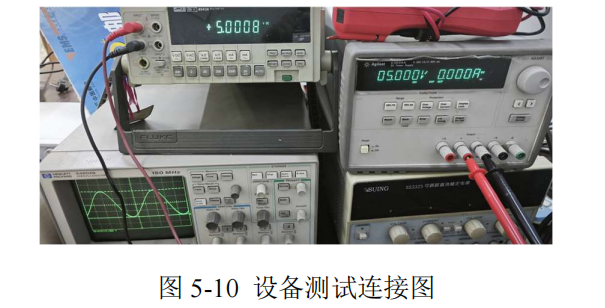
 ![](https://pub-048dcb96257f476697b113fcb5939cb9.r2.dev/blog/159322922/13_8f9598e05a6d4dd884b74