FPGA-based Thermocouple Temperature Measurement Data Acquisition System, a Replacement for NI Products (Part 3) Testing
High-speed Modular Data Acquisition System Lower-level Machine Function Testing
4.2.1 Experimental Platform Setup
Since the system is designed with modularity, it is necessary to verify the functionality of each module before conducting the overall experiment.
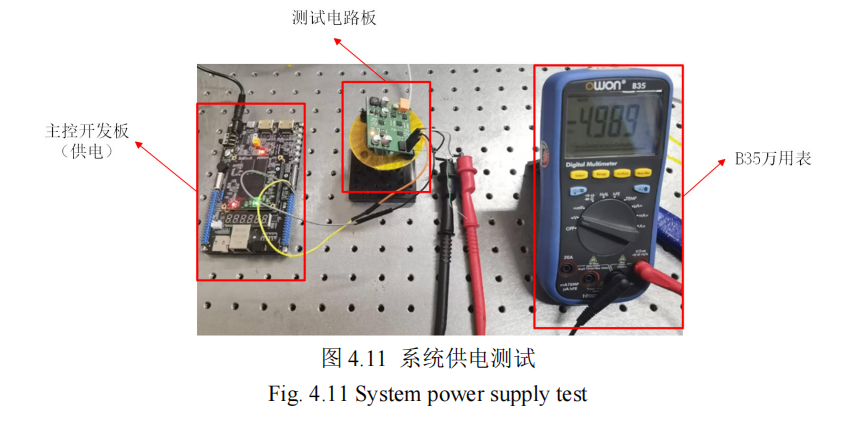
The feasibility of the lower-level machine software was tested in the previous section. As introduced in previous sections, the system is also equipped with a front-end signal processing module, which is divided into two parts: power supply and amplification-filtering. To verify correct functionality, the signal processing module needs to be tested. Testing the power supply module is to verify whether the power supply module generates voltage correctly; testing the amplification-filtering is to ensure that the designed functions can be correctly implemented. Finally, this part of the test is connected with the previous section and connected to the host PC for packet capture and overall testing, to verify the overall functionality of the lower-level machine.
Corresponding experiments are designed based on the testing requirements. The experimental design for this section is shown in Figure 4.8: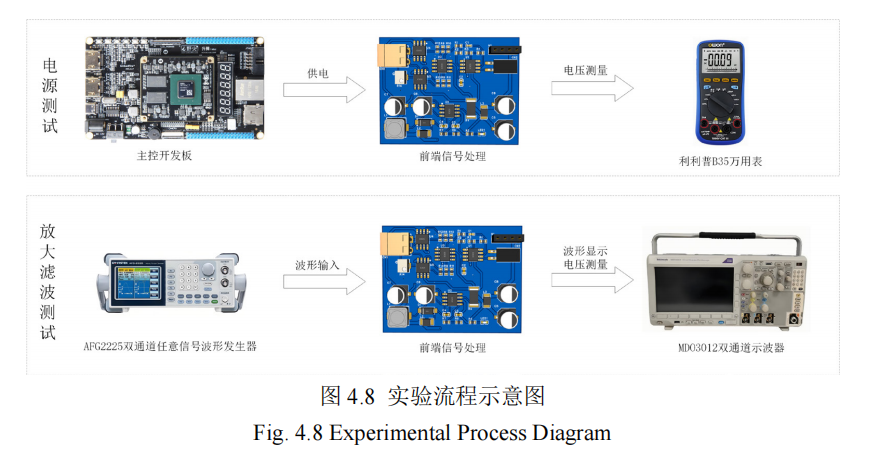
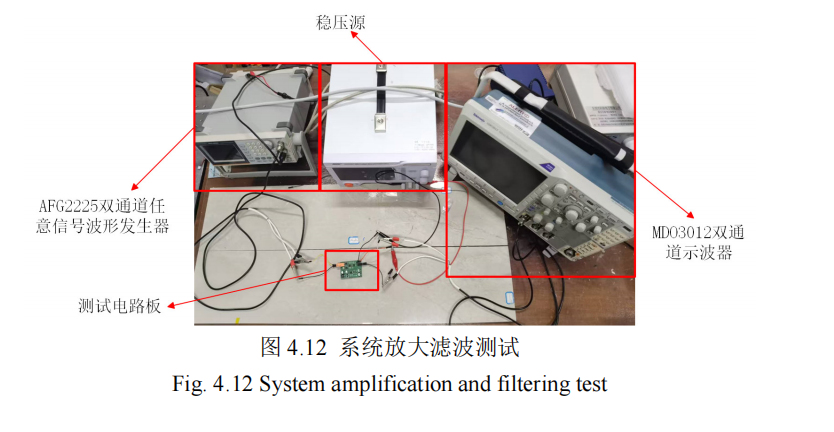
After the power supply test passes, the amplification-filtering function is tested. The amplification-filtering test primarily checks the following functions: the stability of the amplification factor, which affects whether subsequent data can be processed correctly; the error of the amplified voltage, which affects the accuracy of the measurement data; and the spectrum of the waveform before and after amplification, used to observe whether the waveform is distorted and to verify the success of the filter. The test experiment is shown in Figure 4.12. The test results for the amplification factor and amplified voltage error are shown in Table 4.2 (input: triangular wave). The amplification factor is calculated based on peak-to-peak values. The spectrum test results are shown in Figure 4.13 (input: sine wave).
4.3 Overall Testing of the Thin-Film Thermocouple Data Acquisition System
The overall functionality of the lower-level machine has been verified in the previous section. Next is to test the overall functionality, where the main control chip and high-speed ADC use corresponding development boards. The overall functional test platform is shown in Figure 4.15.
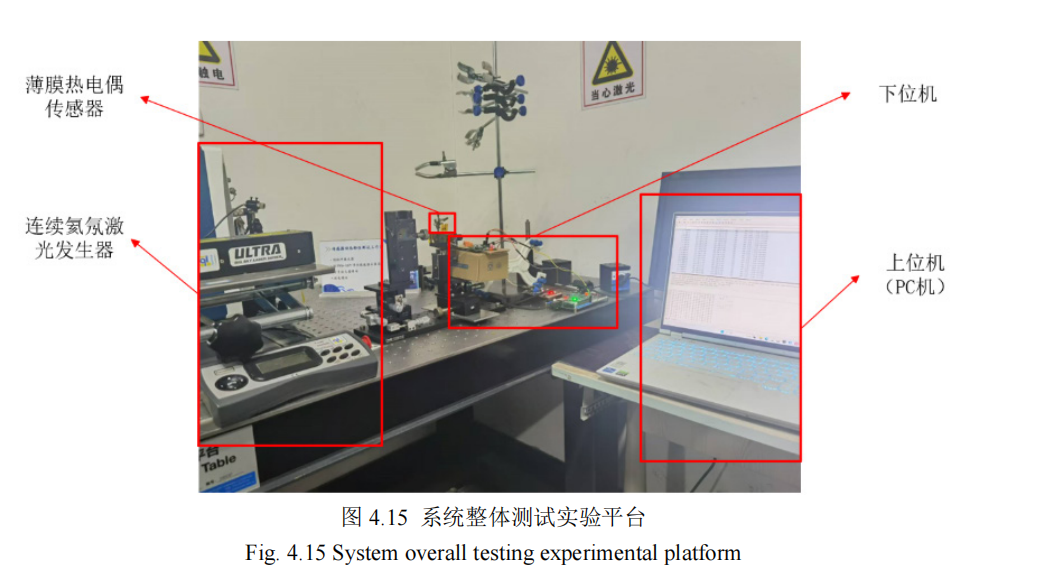
The experiment obtains the sensor's pulse response curve by applying pulse excitation to the thin-film thermocouple using a short-pulse laser. The host PC functionality is achieved by executing three separate codes. During the experiment, the PC performs real-time packet capture on the data, obtaining pcap files. These are then stored in a database via a corresponding program. The database can export corresponding CSV files, and the plotting program can then draw the corresponding curves based on the CSV files.